Note
Click here to download the full example code
Produce a new raster with index stacked in new bands
This example shows how to add to a raster spectral index. Here we add LChloC and ACORVI (a modified NDVI).
Import libraries
import numpy as np
from museopheno import sensors,datasets

# to add custom  creation of new raster, import rasterMath
from museotoolbox.processing import RasterMath
Import dataset
raster,dates = datasets.Sentinel2_3a_2018(return_dates=True)
S2 = sensors.Sentinel2(n_bands=10)

print('Default band order for 10 bands is : '+', '.join(S2.bands_order)+'.')
Out:
Default band order for 10 bands is : 2, 3, 4, 8, 5, 6, 7, 8A, 11, 12.
List of available index :
S2.available_indices.keys()
Out:
dict_keys(['B2', 'B3', 'B4', 'B8', 'B5', 'B6', 'B7', 'B8A', 'B11', 'B12', 'ACORVI', 'ACORVInarrow', 'SAVI', 'EVI', 'EVI2', 'PSRI', 'ARI', 'ARI2', 'MARI', 'CHLRE', 'MCARI', 'MSI', 'MSIB12', 'NDrededgeSWIR', 'SIPI2', 'NDWI', 'LCaroC', 'LChloC', 'LAnthoC', 'Chlogreen', 'NDRESWIR', 'NDVI', 'NDVInarrow', 'NDVIre', 'RededgePeakArea', 'Rratio', 'MTCI', 'S2REP', 'IRECI', 'NBR', 'REP', 'WDRVI_B6B7'])
Define a custom function
def createSITSplusIndex(X):
    X1 = S2.generate_index(X,S2.get_index_expression('LChloC'),multiply_by=100,dtype=np.int16)
    X2 = S2.generate_index(X,S2.get_index_expression('ACORVI'),multiply_by=100,dtype=np.int16)

    return np.hstack((X,X1,X2)).astype(np.int16)
Use rasterMath to read and write block per block the raster according to a function
rM = RasterMath(raster)

X = rM.get_random_block()
print('Block has {} pixels and {} bands'.format(X.shape[0],X.shape[1]))
Out:
Total number of blocks : 1
Block has 55842 pixels and 70 bands
Now we can try our function
XwithIndex = createSITSplusIndex(X)
print('Raster+index produced has {} pixels and {} bands'.format(XwithIndex.shape[0],XwithIndex.shape[1]))
Out:
Raster+index produced has 55842 pixels and 84 bands
Now we add our function as the test was a success
rM.add_function(createSITSplusIndex,'/tmp/SITSwithIndex.tif')
Out:
Using datatype from numpy table : int16.
Detected 84 bands for function createSITSplusIndex.
Produce raster
rM.run()
##################
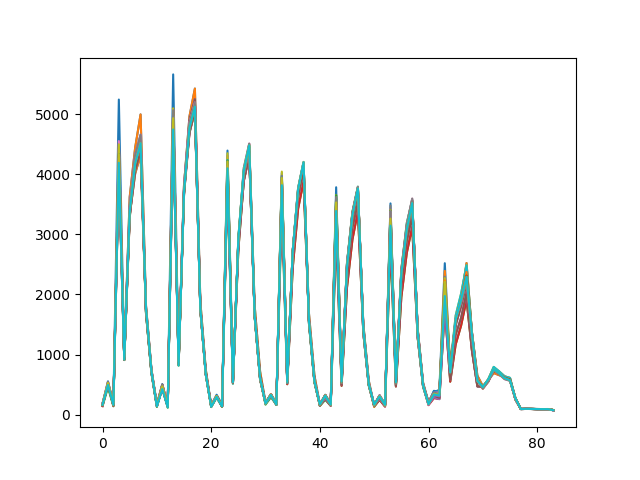
# Plot image
from matplotlib import pyplot as plt
rM = RasterMath('/tmp/SITSwithIndex.tif')
X=rM.get_random_block() #randomly select a block
plt.plot(X[:20,:].T)
Out:
Batch processing (1 blocks using 20Mo of ram)

rasterMath... [########################################]100%
Total number of blocks : 1

[<matplotlib.lines.Line2D object at 0x7f72bd4bbb50>, <matplotlib.lines.Line2D object at 0x7f72bd491690>, <matplotlib.lines.Line2D object at 0x7f72bd4bbcd0>, <matplotlib.lines.Line2D object at 0x7f72bd4bbc10>, <matplotlib.lines.Line2D object at 0x7f72bd4bb5d0>, <matplotlib.lines.Line2D object at 0x7f72bd4bb910>, <matplotlib.lines.Line2D object at 0x7f72bd4bb690>, <matplotlib.lines.Line2D object at 0x7f72bd4bbb10>, <matplotlib.lines.Line2D object at 0x7f72bd4bb4d0>, <matplotlib.lines.Line2D object at 0x7f72bd4bb950>, <matplotlib.lines.Line2D object at 0x7f72bd4d4190>, <matplotlib.lines.Line2D object at 0x7f72bd4bb410>, <matplotlib.lines.Line2D object at 0x7f72bd4bb710>, <matplotlib.lines.Line2D object at 0x7f72bd4bbfd0>, <matplotlib.lines.Line2D object at 0x7f72bef4cc10>, <matplotlib.lines.Line2D object at 0x7f72be1e5e10>, <matplotlib.lines.Line2D object at 0x7f72be1e5710>, <matplotlib.lines.Line2D object at 0x7f72be1e53d0>, <matplotlib.lines.Line2D object at 0x7f72bd78cdd0>, <matplotlib.lines.Line2D object at 0x7f72bd78c090>]
Total running time of the script: ( 0 minutes 3.783 seconds)