Note
Click here to download the full example code
Compute a spectral index or an expression without defining a sensor
This example shows how to compute an expression or an index in a time series (or at one acquisition) without defining a sensor.
Use sample from Sentinel2 level 3A syntheses (from Theia)
from museopheno.time_series import expression_manager
from museopheno import datasets

X,dates = datasets.Sentinel2_3a_2018(return_dates=True,return_random_sample=True)

print(X.shape)
Out:
Total number of blocks : 1
(55842, 70)
We have to define the band order and the number of compenent (i.e. number of band per date)
bands_order = ['2','3','4','8','5','6','7','8A','11','12']
As our raster has 10 bands per date, let’s check the number of columns of X array divided by the numver of bands per date
print('Image contains {} dates.'.format(int(X.shape[1]/len(bands_order))))
Out:
Image contains 7 dates.
Let’s create an expression
expression = 'B8/(B2+1)'

result = expression_manager(X,bands_order=bands_order,expression=expression)

print(result)
Out:
[[29.15     31.653631 28.006369 ... 21.634285 23.138159 11.891509]
 [26.018072 32.120804 28.919708 ... 23.013699 24.86508  12.335052]
 [28.894365 37.02362  30.872    ... 20.8125   20.554745 10.108571]
 ...
 [24.484848 35.560974 24.670807 ... 18.333334 17.838888  8.68    ]
 [27.095238 37.45299  24.62264  ... 18.994566 18.543478  9.601626]
 [32.585365 41.92233  26.326666 ... 18.347368 18.052357  9.585657]]
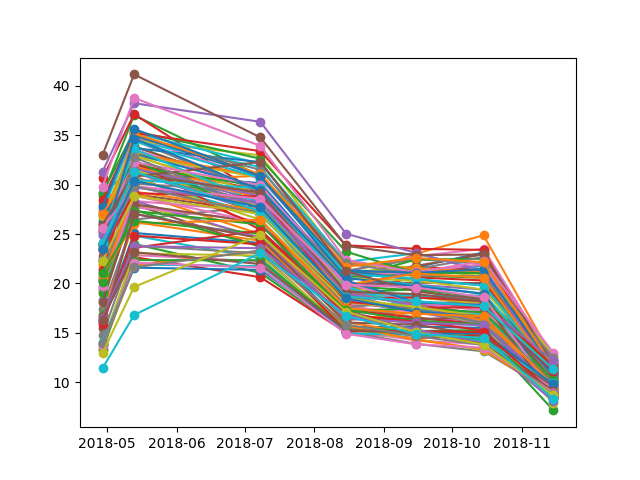
Plot result
from matplotlib import pyplot as plt
from datetime import datetime
dateToDatetime = [datetime.strptime(str(date),'%Y%m%d') for date in dates]
plt.plot_date(dateToDatetime,result.T[:,:100],'-o')
Out:
[<matplotlib.lines.Line2D object at 0x7fafb69d8390>, <matplotlib.lines.Line2D object at 0x7fafb66dea90>, <matplotlib.lines.Line2D object at 0x7fafb6313ed0>, <matplotlib.lines.Line2D object at 0x7fafb6313a90>, <matplotlib.lines.Line2D object at 0x7fafb6313550>, <matplotlib.lines.Line2D object at 0x7fafb6313150>, <matplotlib.lines.Line2D object at 0x7fafb6313b10>, <matplotlib.lines.Line2D object at 0x7fafb6313dd0>, <matplotlib.lines.Line2D object at 0x7fafb6313c10>, <matplotlib.lines.Line2D object at 0x7fafb6313110>, <matplotlib.lines.Line2D object at 0x7fafb63c67d0>, <matplotlib.lines.Line2D object at 0x7fafb6313950>, <matplotlib.lines.Line2D object at 0x7fafb6313590>, <matplotlib.lines.Line2D object at 0x7fafb6313410>, <matplotlib.lines.Line2D object at 0x7fafb6313f90>, <matplotlib.lines.Line2D object at 0x7fafb6313a10>, <matplotlib.lines.Line2D object at 0x7fafb6313450>, <matplotlib.lines.Line2D object at 0x7fafb6313050>, <matplotlib.lines.Line2D object at 0x7fafb6313090>, <matplotlib.lines.Line2D object at 0x7fafb6313c90>, <matplotlib.lines.Line2D object at 0x7fafb6313750>, <matplotlib.lines.Line2D object at 0x7fafb6359dd0>, <matplotlib.lines.Line2D object at 0x7fafb640c790>, <matplotlib.lines.Line2D object at 0x7fafb640cb90>, <matplotlib.lines.Line2D object at 0x7fafb640ce50>, <matplotlib.lines.Line2D object at 0x7fafb640c690>, <matplotlib.lines.Line2D object at 0x7fafb640c4d0>, <matplotlib.lines.Line2D object at 0x7fafb640c190>, <matplotlib.lines.Line2D object at 0x7fafb640cd90>, <matplotlib.lines.Line2D object at 0x7fafb640ca10>, <matplotlib.lines.Line2D object at 0x7fafb640c050>, <matplotlib.lines.Line2D object at 0x7fafb640c390>, <matplotlib.lines.Line2D object at 0x7fafb640c750>, <matplotlib.lines.Line2D object at 0x7fafb640c550>, <matplotlib.lines.Line2D object at 0x7fafb640c090>, <matplotlib.lines.Line2D object at 0x7fafb640cfd0>, <matplotlib.lines.Line2D object at 0x7fafb640c2d0>, <matplotlib.lines.Line2D object at 0x7fafb640c990>, <matplotlib.lines.Line2D object at 0x7fafb69a4550>, <matplotlib.lines.Line2D object at 0x7fafb69a4750>, <matplotlib.lines.Line2D object at 0x7fafb69a48d0>, <matplotlib.lines.Line2D object at 0x7fafb69a4e10>, <matplotlib.lines.Line2D object at 0x7fafb69a47d0>, <matplotlib.lines.Line2D object at 0x7fafb69a4bd0>, <matplotlib.lines.Line2D object at 0x7fafb69a4b10>, <matplotlib.lines.Line2D object at 0x7fafb69a4910>, <matplotlib.lines.Line2D object at 0x7fafb69a44d0>, <matplotlib.lines.Line2D object at 0x7fafb69a4d50>, <matplotlib.lines.Line2D object at 0x7fafb69a4450>, <matplotlib.lines.Line2D object at 0x7fafb6ffcd10>, <matplotlib.lines.Line2D object at 0x7fafb6a1d050>, <matplotlib.lines.Line2D object at 0x7fafb63dcf90>, <matplotlib.lines.Line2D object at 0x7fafb63dcb10>, <matplotlib.lines.Line2D object at 0x7fafb63dc210>, <matplotlib.lines.Line2D object at 0x7fafb63dc610>, <matplotlib.lines.Line2D object at 0x7fafb63dcf10>, <matplotlib.lines.Line2D object at 0x7fafb63dc690>, <matplotlib.lines.Line2D object at 0x7fafb63dc750>, <matplotlib.lines.Line2D object at 0x7fafb63dcd10>, <matplotlib.lines.Line2D object at 0x7fafb63dc2d0>, <matplotlib.lines.Line2D object at 0x7fafb63dc890>, <matplotlib.lines.Line2D object at 0x7fafb673d410>, <matplotlib.lines.Line2D object at 0x7fafb673d290>, <matplotlib.lines.Line2D object at 0x7fafb673df50>, <matplotlib.lines.Line2D object at 0x7fafb673dc90>, <matplotlib.lines.Line2D object at 0x7fafb673d350>, <matplotlib.lines.Line2D object at 0x7fafb673d8d0>, <matplotlib.lines.Line2D object at 0x7fafb673d850>, <matplotlib.lines.Line2D object at 0x7fafb673d590>, <matplotlib.lines.Line2D object at 0x7fafb673d690>, <matplotlib.lines.Line2D object at 0x7fafb673dd10>, <matplotlib.lines.Line2D object at 0x7fafb673d910>, <matplotlib.lines.Line2D object at 0x7fafb673df90>, <matplotlib.lines.Line2D object at 0x7fafb673d4d0>, <matplotlib.lines.Line2D object at 0x7fafb673da50>, <matplotlib.lines.Line2D object at 0x7fafb66ec3d0>, <matplotlib.lines.Line2D object at 0x7fafb66ec890>, <matplotlib.lines.Line2D object at 0x7fafb66ec250>, <matplotlib.lines.Line2D object at 0x7fafb66ecb10>, <matplotlib.lines.Line2D object at 0x7fafb66ecf10>, <matplotlib.lines.Line2D object at 0x7fafb66ec810>, <matplotlib.lines.Line2D object at 0x7fafb66eccd0>, <matplotlib.lines.Line2D object at 0x7fafb66eca50>, <matplotlib.lines.Line2D object at 0x7fafb66ec050>, <matplotlib.lines.Line2D object at 0x7fafb66ec6d0>, <matplotlib.lines.Line2D object at 0x7fafb66ece50>, <matplotlib.lines.Line2D object at 0x7fafb66ecc90>, <matplotlib.lines.Line2D object at 0x7fafb66ecc10>, <matplotlib.lines.Line2D object at 0x7fafb66ec2d0>, <matplotlib.lines.Line2D object at 0x7fafb66ec190>, <matplotlib.lines.Line2D object at 0x7fafb66ec8d0>, <matplotlib.lines.Line2D object at 0x7fafb66ecfd0>, <matplotlib.lines.Line2D object at 0x7fafb66ecf50>, <matplotlib.lines.Line2D object at 0x7fafb66ec790>, <matplotlib.lines.Line2D object at 0x7fafb6378090>, <matplotlib.lines.Line2D object at 0x7fafb6378e10>, <matplotlib.lines.Line2D object at 0x7fafb6378550>, <matplotlib.lines.Line2D object at 0x7fafb6378390>, <matplotlib.lines.Line2D object at 0x7fafb6378cd0>, <matplotlib.lines.Line2D object at 0x7fafb63789d0>]
Total running time of the script: ( 0 minutes 0.984 seconds)